No Labels, No Teacher: How Unsupervised Machine Learning Finds Hidden Customer Groups
Learn how unsupervised machine learning uses StandardScaler and K-Means clustering to discover hidden customer groups from shopping data and turn those patterns into smarter, personalized offers.
No Labels, No Teacher: How Unsupervised Machine Learning Finds Hidden Customer Groups
Imagine you own a large grocery store in Maharashtra. Every day, hundreds or even thousands of customers walk through your doors. Some come in once a month and buy only a few essentials. Some visit every week for their family's regular shopping. Others spend a significant amount of money and return again and again.
Now imagine that you have years of shopping data sitting in a spreadsheet. You know how much each customer spends, how often they visit, and how many items they usually buy. But there is one problem: nobody has told you what type of customer each person is.
You don't have labels such as "Budget Shopper", "Regular Household Customer", or "VIP Customer". You simply have the numbers and want to discover whether meaningful patterns exist inside them.
This is where Unsupervised Machine Learning becomes useful.
Unlike supervised machine learning, where a model learns from examples that already have known answers, unsupervised learning works with data that has no predefined labels. The algorithm looks for similarities, differences, and natural patterns within the data and groups similar records together.
In this example, we will use three simple customer characteristics:
- Monthly Spend: How much money the customer spends in a month.
- Visit Count: How many times the customer visits the store in a month.
- Basket Size: The average number of items purchased during a visit.
From these three numbers alone, a machine learning algorithm may discover that some customers behave similarly, even though nobody explicitly told the computer how to classify them.
That is the interesting part of unsupervised learning. The computer is not given the answer first. It searches the data for structure and helps us understand what might already be there.
In the sections ahead, we will walk through this grocery-store example step by step and see how StandardScaler, K-Means clustering, centroids, and simple customer persona mapping can turn raw shopping data into useful business insights.
What Problem Are We Trying to Solve?
Suppose your grocery store has 10,000 customers. You have a spreadsheet containing their shopping information, but the data does not come with ready-made categories.
For example, you might have a customer record that looks something like this:
Monthly Spend: ₹12,000
Visit Count: 8 visits
Basket Size: 18 items per visit
Another customer might spend only ₹1,500 a month, visit the store twice, and purchase five items on average. A third customer might spend ₹45,000 every month, visit almost every other day, and fill a large shopping cart each time.
All three customers are different, but the data itself does not tell you what those differences mean from a business perspective.
There is no column saying "VIP", "Budget Shopper", or "Regular Customer".
This is the key point behind the problem.
You have customer data, but you do not have predefined answers. You want the machine to examine the data and find customers who behave similarly.
For this example, we will focus on three numerical features:
- Monthly Spend: The total amount a customer spends in one month.
- Visit Count: The number of times the customer visits the store during that month.
- Basket Size: The average number of products purchased in a single visit.
These three features can tell us quite a lot about shopping behaviour. A customer who visits frequently but spends a small amount may have a very different shopping pattern from someone who visits only a few times but makes large purchases.
The challenge is that looking at thousands of rows manually is not practical. Even if you could read every customer record, identifying meaningful groups consistently would be difficult.
This is where clustering becomes useful. Instead of asking the computer to predict a category that we already know, we ask it to look at the available data and discover groups of customers with similar behaviour.
That makes this a classic unsupervised learning problem.
The goal is not to predict a correct answer from historical labels. The goal is to discover patterns that can help us understand the customers we already have.
Why Is This Called Unsupervised Learning?
The word unsupervised can sound a little complicated at first, but the idea is actually quite simple.
Think about the difference between teaching a child with answers and asking a child to discover something independently.
In supervised machine learning, the model learns from data where the expected answer is already available. For example, if you give a model thousands of customer records and tell it which customers are "VIP" and which are "Regular," the model can learn the patterns associated with those labels.
In our grocery store example, we do not have those answers.
We only have information such as how much customers spend, how often they visit, and how many products they usually purchase. Nobody has manually classified them into customer types.
So instead of asking the computer, "Is this customer a VIP or a budget shopper?", we ask a different question:
"Can you find customers who have similar shopping behaviour?"
The machine learning algorithm then examines the available data and looks for natural groupings. Customers with similar spending patterns, visit frequencies, and basket sizes may end up in the same cluster.
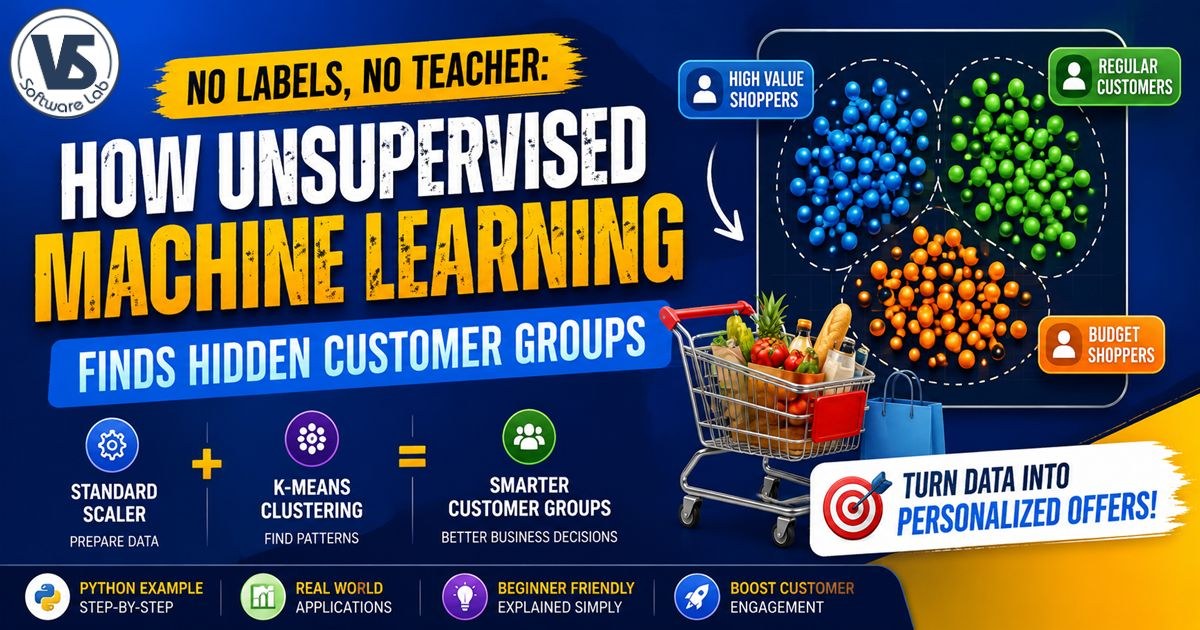
Once these groups are discovered, a human can study them and give them meaningful business names. For example, one group may look like budget shoppers, another may represent regular household customers, and another may contain high-value customers.
The important thing to remember is that the algorithm did not know these names beforehand. It only found patterns in the data. The human interpretation comes afterward.
This is one of the main reasons unsupervised machine learning is useful in business. Sometimes you have a large amount of data but do not yet know what categories or patterns are hidden inside it. Clustering techniques can help you explore that data and find structure that may not be obvious at first glance.
Step 1: Why We Need to Bring the Data to the Same Scale
Before we ask K-Means to find customer groups, there is an important problem we need to solve first.
Our three features are measured using completely different numbers.
- Monthly Spend: ₹1,200, ₹10,000, or ₹50,000
- Visit Count: 1, 5, or 15 visits
- Basket Size: 3, 10, or 30 items
Look at these numbers for a moment. Monthly spending can reach tens of thousands of rupees, while visit count may only be a single-digit or two-digit number.
If we directly give these raw values to a distance-based algorithm such as K-Means, the feature with larger numerical values can have a much stronger influence on the result. In this case, the spending values could dominate the distance calculations simply because their numbers are much larger.
That does not necessarily mean spending is more important than visits or basket size. It is simply a difference in measurement scale.
For example, a change from ₹10,000 to ₹20,000 is a difference of ₹10,000, while a change from 5 visits to 10 visits is a difference of only 5. If we calculate distances directly using these raw numbers, the spending feature can heavily influence how customers are grouped.
We want the algorithm to consider all three aspects of customer behaviour fairly.
This is why data preprocessing is an important part of a machine learning workflow.
Using StandardScaler to Normalize the Features
One common solution is StandardScaler from Python's scikit-learn library.
StandardScaler transforms each feature so that its values are represented on a comparable standardized scale. It does this by using the feature's mean and standard deviation.
You do not need to think of it as changing the actual behaviour of a customer. A customer who spends more money is still a high-spending customer. The transformation simply makes the numerical representation suitable for algorithms that depend on distances.
After scaling, the clustering algorithm can pay attention to differences in monthly spending, visit frequency, and basket size without allowing one feature to dominate merely because its raw numbers are larger.
This step is especially important for K-Means because K-Means uses distances to determine how close data points are to one another.
In simple terms, before clustering our customers, we first make sure that ₹50,000, 15 visits, and 30 items are not being compared as raw numbers without considering their different scales.
Once the data has been scaled, we are ready to move to the central part of our example: finding groups of customers using K-Means clustering.
Step 2: Grouping Similar Customers with K-Means Clustering
Now that our customer data is on a comparable scale, we can start looking for natural groups within it.
This is where K-Means clustering comes in.
K-Means is one of the most commonly used unsupervised machine learning algorithms for clustering. Its job is to divide data points into a chosen number of groups, where customers within the same group have relatively similar characteristics.
For our grocery store, let's say we want to discover three different types of customers. We can tell the algorithm to create 3 clusters by setting the value of K = 3.
But how does the algorithm actually decide which customer belongs to which group?
Imagine putting every customer on a map. Each customer becomes a point on that map based on their monthly spending, visit frequency, and average basket size.
Now imagine placing three temporary markers on the map. These markers are called centroids.
A centroid can be thought of as the approximate centre of a cluster. K-Means repeatedly checks how close each customer is to each centroid and assigns the customer to the nearest group.
After that, the algorithm calculates a new centre for each group based on the customers currently assigned to it. The centroids move, customers may be reassigned, and the process continues.
This happens again and again until the groups become relatively stable and the centroids stop moving significantly.
In simple terms, K-Means is trying to answer one question:
"Which customers behave most like each other?"
After the algorithm finishes, we might discover groups that look something like this:
- Cluster 1: Customers who spend relatively little, visit less frequently, and usually purchase smaller baskets.
- Cluster 2: Customers who visit regularly and make moderate household purchases.
- Cluster 3: Customers who spend significantly more, visit frequently, and purchase large quantities of products.
Notice something important here: we did not manually create these customer categories before running the algorithm.
We simply asked K-Means to find three groups based on the available data. The actual patterns emerged from the relationships between the customers.
Of course, the exact groups will depend on the dataset. Real customer data may not produce such perfectly separated categories, and the algorithm does not automatically know that one group should be called "VIP" or another should be called "Budget Shopper."
That interpretation comes next.
First, let's look at what K-Means actually gives us after clustering and why the numbers Cluster 0, Cluster 1, and Cluster 2 are not meaningful customer names by themselves.
What Does K-Means Actually Give Us?
After K-Means finishes grouping the customers, you might expect the computer to tell you something like "These are your VIP customers" or "These are your budget shoppers."
It doesn't.
The algorithm usually gives each customer a cluster number. For example, you may see results such as:
- Cluster 0
- Cluster 1
- Cluster 2
At first glance, these numbers may not tell you much. A customer assigned to Cluster 0 is not automatically better or worse than a customer in Cluster 2. The numbers are simply identifiers created for the groups.
In fact, you should not assume that Cluster 0 represents your lowest-spending customers or that Cluster 2 represents your highest-spending customers. The cluster numbers themselves have no business meaning.
We need to look inside each cluster and understand the behaviour of the customers who belong to it.
Finding the Meaning Behind Each Cluster
One simple approach is to calculate the average values of the original customer features for every cluster.
For example, after clustering, you might analyse the groups and discover something like this:
- Cluster 0: Average monthly spend of ₹1,500, around 2 visits per month, and an average basket size of 5 items.
- Cluster 1: Average monthly spend of ₹12,000, around 7 visits per month, and an average basket size of 15 items.
- Cluster 2: Average monthly spend of ₹45,000, around 15 visits per month, and an average basket size of 30 items.
Now the groups start to make sense.
Cluster 0 appears to contain customers with relatively low spending and smaller shopping baskets. Cluster 1 looks like a group of regular household shoppers. Cluster 2 appears to contain highly active, high-value customers.
The algorithm found the groups. We are now interpreting what those groups mean in the real world.
This distinction is important because machine learning discovers patterns, while humans provide business context.
The computer can tell us that certain customers behave similarly. It is up to the business to decide what those patterns mean and how they can be used responsibly.
For our grocery store, we can take this one step further and automatically assign meaningful names to the clusters based on their spending behaviour.
That process is what we can call customer persona mapping.
Step 3: Turning Cluster Numbers into Customer Personas
Now comes the part that makes the machine learning result genuinely useful for a business.
Instead of showing a store manager a report filled with Cluster 0, Cluster 1, and Cluster 2, we can translate those groups into descriptions that are easier to understand and act upon.
For example, our analysis might show that one cluster has the lowest average monthly spending, another falls somewhere in the middle, and the third has the highest spending.
We can then create simple business rules to map those clusters to customer personas.
The cluster with the lowest average spending could be labelled Budget or Local Shoppers.
The middle group could be called Regular Household Shoppers.
The cluster with the highest average spending could be identified as High-Value Customers or Metro VIP Shoppers.
The important point is that these names are not produced by K-Means itself. They are meaningful labels added by us after examining the characteristics of each cluster.
For example, our logic could work like this:
- Find the cluster with the lowest average monthly spend and map it to Budget / Local Shoppers.
- Find the cluster with the highest average monthly spend and map it to High-Value Metro VIPs.
- Assign the remaining cluster to Regular Household Shoppers.
This approach makes the final output much easier for a business team to understand. Instead of saying, "Customer 458 belongs to Cluster 2," the system can report, "Customer 458 belongs to the High-Value Customer segment."
There is one important caution, though. These personas are interpretations of the patterns found in the data. They do not necessarily tell us why a customer behaves that way.
For example, a high-spending customer may be buying groceries for a large family, running a small food business, or simply purchasing in bulk once a month. The clustering algorithm cannot know the reason unless that information is included in the data.
So, customer segmentation should be treated as a way to understand behaviour, not as a perfect description of a person's identity.
Once these groups have been identified and interpreted, the real business value becomes clear. We can start designing offers and communication strategies that are more relevant to each customer segment.
Why Is Customer Segmentation Useful in a Real Grocery Store?
Finding customer groups is interesting, but the real question is: What can a business actually do with this information?
Imagine that your grocery store has thousands of customers. Sending exactly the same offer to everyone may not be the best approach. A discount that is attractive to one customer may be completely irrelevant to another.
Customer segmentation helps you understand these differences.
For example, suppose your clustering analysis has identified three broad customer groups.
Budget or Local Shoppers
These customers may visit less frequently, spend smaller amounts, and purchase a limited number of products. You might attract them with discounts on everyday essentials, value packs, or small purchase incentives.
The goal could be to encourage them to visit more often or increase the size of their shopping basket.
Regular Household Shoppers
This group may visit the store regularly and purchase common household products. They could be interested in weekend family offers, monthly grocery bundles, or discounts on frequently purchased items.
For these customers, consistency and convenience may matter more than a single large discount.
High-Value Customers
These customers may spend significantly more and visit the store frequently. They could be valuable members of a loyalty program and may respond well to premium services, exclusive offers, early access to promotions, or personalized rewards.
The idea is not simply to give everyone a discount. It is to understand customer behaviour and make business decisions based on patterns in the data.
This can also help a grocery store think about inventory and marketing. If a particular customer segment frequently purchases certain categories of products, the business may use that information when planning promotions or understanding demand.
Of course, a real business should not rely on clustering alone. Customer preferences can change over time, and a customer's spending behaviour does not always explain the reason behind a purchase. The best results come when machine learning insights are combined with business knowledge and other reliable customer information.
Still, even a simple clustering model can provide a useful starting point. Instead of treating thousands of customers as one large, identical group, the business gets a clearer picture of different shopping patterns.
Let's See the Complete Python Example
Now that we understand the idea behind the process, let's turn it into a practical Python example.
We will create a small customer dataset containing three features: Monthly Spend, Visit Count, and Basket Size. We will then scale the data, apply K-Means clustering, examine the resulting groups, and map those groups to simple customer personas.
The example below is intentionally simple. The goal is not to build a production-ready retail recommendation system in a few lines of code. Instead, it is to understand how the main pieces of an unsupervised machine learning workflow fit together.
Step 1: Install the Required Python Libraries
If you are running this example on your own computer and the required libraries are not already installed, open your terminal or command prompt and run the following command:
#language:python
pip install pandas numpy scikit-learn
We will use Pandas to work with the customer data, NumPy to generate sample data, and scikit-learn for StandardScaler and K-Means clustering.
Step 2: Import the Libraries
Now import the libraries required for the example:
#language:python
import pandas as pd
import numpy as np
from sklearn.preprocessing import StandardScaler
from sklearn.cluster import KMeans
With these libraries ready, we can move on to creating our sample grocery store customer dataset.
Step 3: Create Sample Customer Shopping Data
For this example, let's imagine that our grocery store has data from 30 customers. Each customer has three important shopping characteristics: how much they spend each month, how often they visit the store, and how many items they usually purchase in one visit.
We can represent this information in a Pandas DataFrame. Each row represents one customer, while each column represents a feature that describes their shopping behaviour.
#language:python
customer_data = pd.DataFrame({
    "Monthly_Spend": [
        1200, 1500, 1800, 2200, 2500,
        11000, 12500, 13500, 14500, 16000,
        38000, 40000, 42000, 45000, 50000
    ],
    "Visit_Count": [
        1, 2, 2, 3, 3,
        6, 7, 7, 8, 9,
        12, 13, 14, 15, 16
    ],
    "Basket_Size": [
        3, 4, 5, 5, 6,
        12, 14, 15, 16, 18,
        25, 27, 28, 30, 35
    ]
})

print(customer_data)
This small dataset gives us three different patterns of shopping behaviour. The first group contains customers with relatively low monthly spending and smaller baskets. The second group represents customers who shop more regularly and purchase a moderate number of items. The third group contains customers with significantly higher spending, more frequent visits, and much larger baskets.
In a real grocery store, the dataset would normally contain many more customers and would be loaded from a CSV file, Excel spreadsheet, database, or business management system. The basic idea, however, remains the same: each customer is represented by numerical features that describe their behaviour.
Step 4: Select the Features for Clustering
Next, we select the three columns that we want K-Means to use when comparing customers.
#language:python
features = customer_data[
    ["Monthly_Spend", "Visit_Count", "Basket_Size"]
]
We are deliberately using only these three features in this example. This makes it easier to understand how the algorithm works. In a real project, you could include additional useful features, such as average transaction value, purchase frequency, product categories, discount usage, or the number of months the customer has been active.
However, adding more columns does not automatically make a clustering model better. Every feature should have a clear reason for being included, and the data should be prepared carefully before training the model.
Now we have our customer features ready. The next step is to make sure that monthly spending does not overpower visit count and basket size simply because it uses larger numbers.
Step 5: Scale the Customer Data
Now we reach an important step in our machine learning workflow.
Our three features have very different numerical ranges. Monthly spending may be measured in thousands of rupees, while visit count and basket size may be much smaller numbers.
If we give these raw values directly to K-Means, the monthly spending feature can have a much stronger effect on the distance calculations. We want the algorithm to consider all three features fairly.
This is where StandardScaler helps us.
We first create a scaler and then use it to transform our customer data:
#language:python
scaler = StandardScaler()

scaled_data = scaler.fit_transform(features)

print(scaled_data)
The fit_transform() method first learns the statistical properties of each feature from our data and then transforms the values into a standardized form.
The important thing to understand is that we are not changing the customer's actual behaviour. A customer who spends ₹50,000 is still a high-spending customer. We are simply transforming the numerical representation so that features measured on different scales can work more fairly together during clustering.
After this step, our variable scaled_data contains the transformed values that we will provide to the K-Means algorithm.
This is a common preprocessing step when working with distance-based machine learning algorithms. Since K-Means calculates distances between data points and cluster centroids, scaling can have a significant impact on the groups the algorithm discovers.
With the data now prepared, we can finally ask K-Means to find three natural customer groups.
Step 6: Apply K-Means Clustering
Our customer data has now been scaled, so we are ready to run the clustering algorithm.
For this example, we want to divide our customers into three groups. In K-Means, the number of groups we want to create is represented by the value of K.
Since we want three customer segments, we set n_clusters=3.
#language:python
kmeans = KMeans(n_clusters=3, random_state=42, n_init=10)

kmeans.fit(scaled_data)
The n_clusters=3 parameter tells K-Means to create three clusters.
The random_state=42 parameter helps us get consistent results when we run the code again. This is useful when learning and testing because we can reproduce the same clustering process.
The n_init=10 parameter tells K-Means to run the clustering process multiple times with different initial centroid positions and keep the result that performs best among those runs.
When we call fit(), the algorithm starts looking for the three groups in our customer data.
Behind the scenes, K-Means begins with initial centroids, assigns each customer to the nearest centroid, calculates new centroid positions, and repeats the process. The algorithm continues updating the groups until the centroids become stable or the maximum number of iterations is reached.
The result is a set of customer groups discovered from the data itself.
Step 7: Assign a Cluster Number to Every Customer
Now that the model has learned the clusters, we can ask it to assign every customer to one of those groups.
#language:python
customer_data["Cluster"] = kmeans.labels_

print(customer_data)
A new Cluster column is now added to our original customer DataFrame.
Each customer will receive a number such as 0, 1, or 2.
Remember that these numbers are only identifiers. Cluster 0 is not automatically the lowest-value group, and Cluster 2 is not automatically the VIP group. The numbering can change depending on how K-Means initializes and organizes the clusters.
To understand what each cluster actually represents, we need to go back to the original customer data and calculate the average shopping behaviour of each group.
That is where the machine learning output becomes much more useful from a business perspective. Instead of looking at anonymous cluster numbers, we can examine spending, visit frequency, and basket size to understand the type of customer represented by each group.
Step 8: Understand What Each Cluster Represents
At this point, every customer has been assigned to a cluster, but we still do not know what those clusters mean in practical terms.
To understand them, we can calculate the average values of our original customer features for each cluster.
#language:python
cluster_summary = customer_data.groupby("Cluster")[
    ["Monthly_Spend", "Visit_Count", "Basket_Size"]
].mean()

print(cluster_summary)
This gives us a summary of the typical customer behaviour within each cluster.
For example, the output might show that one cluster has a low average monthly spend, fewer visits, and smaller baskets. Another cluster may have moderate values across all three features. A third cluster may have very high spending, frequent visits, and large baskets.
We can now compare the clusters based on their average monthly spending.
#language:python
print(cluster_summary["Monthly_Spend"].sort_values())
This simple comparison helps us understand which cluster represents lower-spending customers and which represents higher-spending customers.
However, there is an important detail to remember. We are using the original, unscaled customer data for this interpretation. This makes the results much easier for a business person to understand because we can talk about actual rupee amounts, actual visits, and actual basket sizes.
For example, instead of saying that a cluster has a higher standardized spending score, we can say that customers in this group spend an average of around ₹40,000 per month.
That makes the machine learning output much easier to connect with real business decisions.
Step 9: Automatically Map Clusters to Customer Personas
Now we can take the analysis one step further. Instead of manually looking at the results and deciding which cluster is the lowest or highest spending group, we can let Python identify them for us.
First, we find the cluster with the lowest average monthly spending and the cluster with the highest average monthly spending.
#language:python
lowest_spend_cluster = cluster_summary["Monthly_Spend"].idxmin()

highest_spend_cluster = cluster_summary["Monthly_Spend"].idxmax()
The idxmin() method gives us the cluster with the lowest average spending, while idxmax() gives us the cluster with the highest average spending.
We can then create a simple mapping between the cluster numbers and meaningful customer personas.
#language:python
persona_mapping = {}

for cluster in cluster_summary.index:
    if cluster == lowest_spend_cluster:
        persona_mapping[cluster] = "Budget / Local Shoppers"
    elif cluster == highest_spend_cluster:
        persona_mapping[cluster] = "High-Value Metro VIPs"
    else:
        persona_mapping[cluster] = "Regular Household Shoppers"

print(persona_mapping)
Finally, we can use this mapping to add a readable customer persona to every row in our dataset.
#language:python
customer_data["Customer_Persona"] = customer_data["Cluster"].map(
    persona_mapping
)

print(customer_data)
Now our data is much easier to understand. Instead of seeing only Cluster 0, Cluster 1, or Cluster 2, each customer has a descriptive persona based on the patterns discovered by the clustering algorithm.
This is a simple example of how an unsupervised machine learning model can move from raw data to an output that a business team can actually understand and use.
Step 10: Turning Customer Segments into Better Offers
At this stage, our machine learning workflow is complete. We started with raw customer shopping data, scaled the features, used K-Means to discover groups, and then translated those groups into customer personas.
But a business does not run machine learning models just to create interesting charts or cluster numbers. The real value comes from what we do with the information.
Imagine that our grocery store has identified three customer segments.
Budget / Local Shoppers
These customers may spend less and visit the store less frequently. The business could experiment with offers on everyday essentials, smaller value packs, or discounts designed to encourage another visit.
For example, a customer who usually buys only a few products might respond better to a simple offer on frequently purchased essentials than to an expensive premium loyalty program.
Regular Household Shoppers
These customers visit more regularly and make moderate household purchases. They may be interested in weekly promotions, family packs, monthly grocery bundles, or rewards based on repeat purchases.
The objective here could be to make regular shopping more convenient while encouraging customers to purchase a broader range of products.
High-Value Metro VIPs
These customers have higher spending and more frequent shopping behaviour. The store may choose to offer them premium loyalty benefits, exclusive deals, early access to special promotions, or personalized rewards.
The goal is not necessarily to give the biggest discount. It may be more valuable to recognize their loyalty and give them benefits that encourage them to continue shopping with the store.
This is where customer segmentation becomes useful. Instead of sending one generic promotion to every customer, a business can begin thinking about different groups and their likely needs.
Of course, the actual offers should be tested. A clustering model tells us that customers behave similarly based on the features we provided. It does not guarantee that a particular offer will increase sales. Businesses should measure the results of campaigns and use that feedback to improve their strategy.
In a larger system, the customer segments could also be refreshed regularly. A customer who was once a high-value shopper may change their behaviour over time, while a regular customer may gradually become a high-value customer. Customer segmentation is therefore not necessarily a one-time exercise.
The most useful approach is to treat clustering as a tool for understanding customer behaviour and supporting better decisions, rather than as a final answer by itself.
What Does This Example Teach Us About Unsupervised Machine Learning?
Our grocery store example may look simple, but it demonstrates the basic workflow behind a real unsupervised machine learning project.
We started with customer data that had no predefined labels. Nobody told the algorithm which customers were budget shoppers, regular customers, or VIPs. Instead, we gave the model numerical information about customer behaviour and asked it to find natural patterns.
The process can be summarized in a simple flow:
Raw Customer Data → Feature Selection → Feature Scaling → K-Means Clustering → Cluster Analysis → Customer Personas → Business Decisions
Each step has a specific purpose.
Raw customer data gives us the information we want to study. In our example, this included monthly spending, visit count, and basket size.
Feature selection determines which customer characteristics the algorithm should use when comparing customers.
Feature scaling helps prevent large numerical values from dominating the distance calculations used by K-Means.
K-Means clustering searches for groups of customers with similar patterns in the selected features.
Cluster analysis helps us understand the characteristics of each group using the original data.
Customer personas give the discovered groups meaningful names that people can understand more easily.
Finally, business decisions use those insights to design more relevant offers, loyalty programs, marketing campaigns, or other customer strategies.
The important lesson is that unsupervised machine learning does not magically understand your business. It finds patterns in the data you provide. Humans still need to interpret those patterns, check whether they make sense, and decide how to use them responsibly.
That combination of machine intelligence and human judgment is what makes a simple clustering model useful in a real-world setting.
What Are the Limitations of K-Means Customer Segmentation?
K-Means clustering is useful, but it is important not to treat its output as a perfect picture of your customers.
The quality of the results depends heavily on the data you provide and the decisions you make before running the algorithm.
For example, in our grocery store example, we used only three features: monthly spending, visit count, and basket size. These features can reveal useful patterns, but they do not explain everything about a customer.
A customer who spends ₹40,000 in a month might be buying groceries for a large family. Another customer might spend the same amount because they run a small restaurant. From the perspective of our three features, they may look similar, but their actual needs could be completely different.
This is why adding relevant business context can make customer segmentation more meaningful.
Another challenge is deciding how many clusters to create. We chose three groups because it makes the example easy to understand. In a real project, the correct number of clusters may not be obvious.
Businesses can use techniques such as the Elbow Method or Silhouette Score to help evaluate different choices of K. However, the mathematically suitable number of clusters is not always the same as the number of customer segments that is most useful for a business.
There is also the question of scaling. StandardScaler is helpful for many K-Means applications, but the choice of preprocessing method should depend on the nature of the data. If the dataset contains extreme outliers, for example, the results may be affected significantly.
Most importantly, clustering does not prove that one customer group is more valuable than another. It simply identifies groups based on the features and distance calculations used by the model.
Therefore, before using customer segments for marketing or business decisions, it is a good practice to review the results, understand the data, validate the clusters, and monitor whether the resulting strategies actually work.
A machine learning model should support business judgment, not replace it.
Where Can Unsupervised Machine Learning Be Used Beyond Grocery Stores?
The grocery store example is only one way to understand unsupervised machine learning. The same basic idea can be applied whenever a business has a large amount of data but does not already know the natural groups hidden inside it.
For example, an online shopping company might group customers based on purchase frequency, average order value, and browsing behaviour. A bank could explore transaction patterns to identify unusual behaviour or discover different customer profiles. A streaming platform could group users according to their viewing habits. A manufacturing company might use clustering to study machine sensor data and identify different operating patterns.
In marketing, customer segmentation is one of the most common practical applications. Instead of treating every customer as part of one large audience, businesses can explore whether different groups behave differently.
Unsupervised learning can also be useful for exploratory data analysis. Sometimes the goal is not to immediately make a prediction or automate a decision. The first step may simply be to understand what patterns exist in a dataset.
This is particularly valuable when working with new or unfamiliar data. A clustering algorithm can help analysts ask better questions about the information they have.
However, the algorithm should always be selected according to the problem. K-Means works well for many clustering tasks, but it is not the right choice for every dataset. Some data may contain irregularly shaped groups, strong outliers, or categorical variables that require different approaches.
Other clustering techniques, such as DBSCAN and hierarchical clustering, can be useful in situations where K-Means may not be the best fit.
The broader lesson is simple: unsupervised machine learning is not limited to finding customer groups. It is a way of exploring data when meaningful patterns may exist but predefined labels are not available.
Once you understand that idea, algorithms such as K-Means become much easier to understand. You are no longer just learning a Python library or memorizing a machine learning formula. You are learning how to ask a computer to help you discover structure in data that you may not have been able to see yourself.
Frequently Asked Questions About Unsupervised Machine Learning
What is unsupervised machine learning in simple words?
Unsupervised machine learning is a type of machine learning where an algorithm works with data that does not have predefined labels or correct answers. Instead of being told what each record represents, the algorithm looks for patterns, similarities, or natural groups within the data.
In our grocery store example, we did not tell the computer which customers were VIPs or budget shoppers. We provided shopping behaviour data and allowed K-Means to discover groups based on similarities between customers.
What is K-Means clustering used for?
K-Means clustering is commonly used to divide data into a chosen number of groups based on similarity. It can be used for customer segmentation, exploratory data analysis, market research, image processing, and many other applications where discovering natural groups is useful.
Why do we use StandardScaler before K-Means?
StandardScaler is often used because K-Means relies on distance calculations. If features have very different numerical ranges, a feature with larger numbers can have a disproportionate influence on the clustering result. Scaling puts the features on a comparable standardized scale so that the algorithm can consider them more fairly.
What is a centroid in K-Means?
A centroid is the centre point representing a cluster. K-Means assigns data points to the nearest centroid and repeatedly updates the centroid positions until the clusters become stable. You can think of a centroid as the approximate centre of a group of similar customers.
How does K-Means decide which customer belongs to which cluster?
K-Means compares the distance between each customer and the cluster centroids. A customer is assigned to the closest centroid based on the features used by the model. The centroids are then recalculated, and the process repeats until the algorithm converges or reaches its stopping conditions.
Does K-Means automatically know that a customer is a VIP?
No. K-Means does not understand business labels such as VIP, budget shopper, or regular customer. It only identifies groups based on patterns in the data. A human or a separate business rule must interpret the clusters and assign meaningful names based on their characteristics.
How do I choose the number of clusters in K-Means?
The number of clusters, represented by K, should be selected carefully. Techniques such as the Elbow Method and Silhouette Score can help evaluate different values of K. Business knowledge also matters because the most mathematically suitable number of clusters may not always produce the most useful customer segments for a particular business.
Can K-Means be used with real customer data?
Yes. K-Means can be used for real customer segmentation when the available features are suitable for clustering. However, real datasets require careful data cleaning, feature selection, preprocessing, validation, and privacy considerations before the results are used for business decisions.
What is the difference between supervised and unsupervised learning?
Supervised learning uses labelled training data where the expected output is already known. Unsupervised learning works with data without predefined labels and attempts to discover patterns or structure on its own. Classification and regression are common supervised learning tasks, while clustering is a common unsupervised learning task.
Is customer segmentation the same as customer classification?
Not exactly. Customer segmentation often involves discovering natural groups in data, which is commonly done using unsupervised learning techniques such as clustering. Classification, on the other hand, usually involves predicting a known category using labelled examples. The two concepts can be related, but they solve different problems.
Final Thoughts: The Real Value Is in Finding the Pattern
Unsupervised machine learning can sound like a complicated topic when you first hear terms such as StandardScaler, K-Means, centroids, and clustering.
But when we look at the problem through a simple grocery store example, the basic idea becomes much easier to understand.
We started with something very ordinary: customer shopping data.
We knew how much customers spent, how often they visited, and how many items they typically purchased. What we did not know was whether those customers naturally belonged to different groups.
Instead of manually reviewing thousands of customer records, we used an unsupervised machine learning approach to discover patterns in the data.
First, we scaled the features so that monthly spending, visit count, and basket size could be considered more fairly. Then, K-Means clustering grouped customers based on similarities in their shopping behaviour. Finally, we studied those clusters and translated the results into simple customer personas that a business could understand.
The machine did not know what a VIP customer was. It did not know what a budget shopper meant. It simply found patterns.
That is the real strength of unsupervised learning.
It helps us explore data when we do not already have all the answers.
Of course, the quality of the result depends on the quality of the data, the features we choose, the clustering method we use, and how carefully we interpret the results. A model should never be treated as a magic box that automatically understands customers or businesses.
But when used thoughtfully, clustering can give businesses a completely different way to look at their data.
Instead of asking, "What does this one customer look like?", we can start asking, "What kinds of customers are hidden inside our entire customer base?"
And sometimes, that simple question can lead to insights that were sitting quietly inside the data all along.
One Last Takeaway
If you are learning machine learning, don't focus only on memorizing algorithms.
Try to understand the problem each algorithm is solving.
In this case, the problem was simple: we had customer data, but no labels, and we wanted to discover natural groups.
That is where unsupervised machine learning and K-Means clustering can help.
Once you understand that connection between the business problem, the data, the algorithm, and the final decision, machine learning becomes much more than code. It becomes a practical way to find useful patterns in the world around us.
Try It Yourself: Start with a Small Dataset
If you are learning Python and machine learning, the best way to understand clustering is to experiment with it yourself.
Start with a small dataset containing customer information such as monthly spending, number of visits, and average basket size. Run the K-Means algorithm, examine the clusters, and then change the data to see how the results change.
Try adding a few new customers with very high spending. Then add customers who visit frequently but spend less on each visit. You may notice that the cluster assignments change as the overall customer behaviour changes.
You can also experiment with different values of K. Try creating two clusters, then three, four, or five. Compare the results and ask yourself whether the groups actually make business sense.
This kind of experimentation is often more valuable than simply reading about an algorithm.
Once you are comfortable with the basic example, you can take the next step and work with a larger dataset. You might load customer records from a CSV file, clean missing values, explore the data using visualizations, test different clustering techniques, and evaluate the quality of the resulting groups.
You could even extend the project by adding features such as:
- Average transaction value
- Purchase frequency
- Discount usage
- Product categories purchased
- Customer loyalty duration
- Online versus offline purchases
- Average time between visits
With more relevant data, you may discover patterns that are not visible when using only three features.
Just remember that more data does not automatically mean better results. The features you choose should have a clear connection to the business question you are trying to answer.
If your goal is to understand customer behaviour, start by asking a simple question: What do I actually want to learn about these customers?
Once that question is clear, you can decide which data to collect, which algorithm to try, and how to evaluate whether the results are genuinely useful.
Conclusion
Unsupervised machine learning becomes much easier to understand when we connect it to a problem that businesses actually face.
Our grocery store example started with a simple question: Can we discover different types of customers without manually labelling every customer ourselves?
With the help of customer data, feature scaling, and K-Means clustering, we were able to find groups of customers with similar shopping behaviour. We then looked at those groups from a business perspective and created meaningful customer personas such as Budget / Local Shoppers, Regular Household Shoppers, and High-Value Metro VIPs.
The important lesson is not just how to write a few lines of Python code. It is understanding the complete journey from raw data to meaningful insight.
Unsupervised learning can help us discover patterns that we may not have noticed before. But the algorithm is only one part of the process. Good results also depend on selecting useful features, preparing the data correctly, choosing an appropriate clustering method, validating the results, and applying human judgment.
Whether you are working with grocery customers, online shoppers, banking transactions, or another type of business data, the same fundamental idea can apply: when you don't have predefined labels, machine learning can help you explore the patterns hidden inside your data.
And sometimes, the most valuable insight is not the answer you expected to find. It is the pattern you didn't know was there.
Start with the data. Ask the right question. Let the patterns guide your next decision.
About the Author
Mr. Sachin Atole is the CEO of VS Software Lab, with a strong interest in software development, emerging technologies, artificial intelligence, machine learning, and practical technology education. Through his work, he focuses on helping students, developers, and businesses understand technology in a simple, practical, and meaningful way.
At VS Software Lab, the focus is on turning technology concepts into practical solutions and creating opportunities for learners to gain hands-on exposure to real-world projects.
Ready to Move Beyond Tutorials?
Reading about Python, Machine Learning, and Artificial Intelligence is a good place to start. But real learning begins when you build something yourself.
Take a dataset. Write the code. Make mistakes. Fix them. Test different approaches. Then ask yourself what the results actually mean in the real world.
That is how concepts like Python, Machine Learning, Data Science, and AI become practical skills instead of just topics you have read about.
If you are a student, fresher, or aspiring technology professional who wants to learn through hands-on projects and practical problem-solving, don't stop at watching tutorials or collecting certificates. Start building.
Want to learn by working on practical technology projects?
Get in touch with us and explore opportunities to strengthen your skills through practical exposure, real-world problem-solving, and project-based learning.
Start Your Practical Learning Journey →
Your next project could be the one that teaches you more than your next ten tutorials.